 | Bereits im Jahr 2016 habe ich damit begonnen an "Importnachfrageelastizitäten" und nicht-tarifären Handelsmaßnahmen zu arbeiten. Eine meiner ersten Arbeiten ist nun nach mehrmaliger Überarbeitung im Journal of International Trade and Economic Development veröffentlicht! https://doi.org/10.1080/09638199.2021.1951820 Warum interessieren mich (bzw HandelsökonomInnen allgemein) diese Elastizitäten? Weil sie eine Antwort geben auf die Frage: "Wie würden sich Importmengen ändern, wenn der Preis des Importgutes um 1% anstiege?" Wenn man diese Info für viele Länder und Produkte zur Hand hat, ist es möglich sogenannte Wertzolläquivalente zu berechnen, die nicht-tarifäre Handelspolitiken (zB Standards, Inspektionen, Verpackungsvorschriften etc) mit Zöllen und untereinander hinsichtlich des Effekts für den internationalen Handel vergleichbar machen. |
|
0 Comments
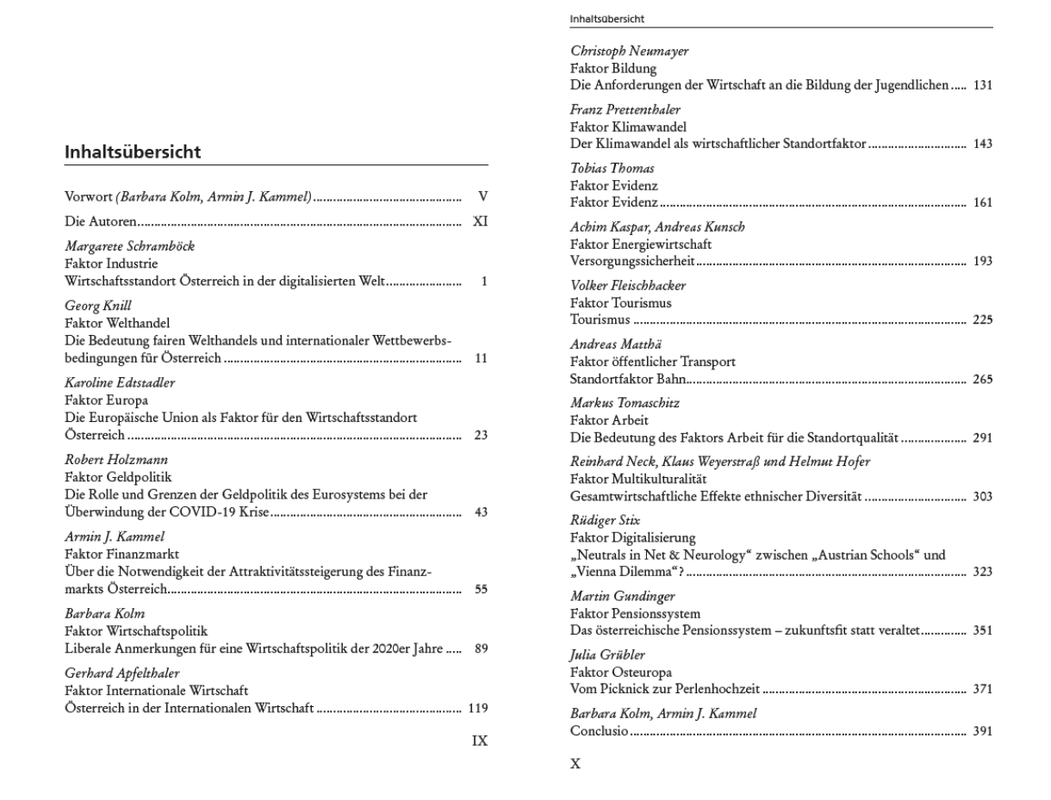
 Ich freue mich sehr, dass mein Artikel zur chinesischen "Belt and Road Initiative" (auch Neue Seidenstraße) seit 7.Juli 2021 im Asia Europe Journal veröffentlicht ist. Am 27.05. ist das Buch "Wirtschaftsstandort Österreich" erschienen. Es enthält auch ein Kapitel von mir zum "Faktor Osteuropa". ISBN 978-3-7046-8710-4 (Print) - ISBN 978-3-7046-8792-0 (eBook) - https://www.verlagoesterreich.at/wirtschaftsstandort-oesterreich/99.105005-9783704687104
Ich habe mich in den letzten Jahren immer wieder mit nicht-tarifären Handelsbarrieren beschäftigt. Womit...?!? Mit jeglicher Form von Maßnahmen, die keine klassischen Zölle darstellen und den Handel zwischen Ländern erschweren. In einem zweistündigen Seminar durfte ich am 1. Dezember 2020 mit Oliver Reiter (wiiw) im Rahmen des AW-Curriculums des Bundesministeriums für Digitalisierung und Wirtschaftsstandort (BMDW) über das Kompetenzzentrum Forschungsschwerpunkt Internationale Wirtschaft (FIW) verschiedenste Typen von nicht-tarifären Maßnahmen vorstellen. Viele davon erschweren zwar den Handel, haben aber eigentlich wichtigere Ziele, etwa den Schutz der Gesundheit über entsprechende Produktstandards. Anders verhält es sich mit handelspolitischen Schutzmaßnahmen, die explizit gesetzt werden, um den negativen Effekten stark steigender Importe entgegenzuwirken. Hierzu durfte ich am 26. Mai 2021 in einer halben Stunde im Rahmen einer Außenwirtschaftsvorlesung meinen FIW Policy Brief vorstellen. Ich freue mich sehr, dass zwei Expertinnen des BMDW ein Koreferat dazu gehalten haben..
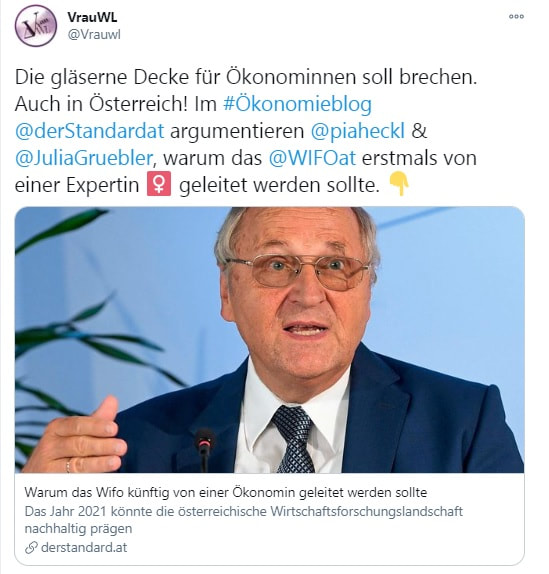
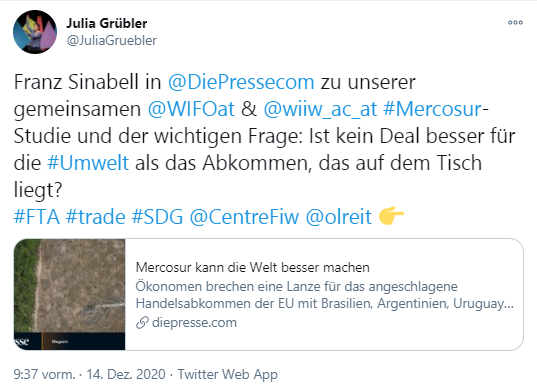
By Julia Grübler, Roman Stöllinger und Gabriele Tondl
Environmental protection versus international trade The adoption of the European Green Deal shifted climate protection and environmental sustainability into the focus of EU policies. Trade policy may be a crucial tool in achieving impact across EU borders. Its primary instruments are bi- and plurilateral free trade agreements (FTAs), which stretch all over the world. The premise that FTAs, whose principal objective is to remove trade barriers between participating partners, can contribute to environmental and climate protection, seems surprising at first. After all, lower trade barriers usually mean more international trade and additional emissions related to increased production and transport services. Particularly in developing countries, facilitated access to new markets through FTAs often results in unintended negative environmental effects, e.g. through the establishment of monocultures or accelerated deforestation, which often goes hand in hand with export-oriented agricultural production. Environmental provisions in trade agreements In the European Commission's view, EU trade policy can effectively influence climate and environmental policies of partner countries . In recent years, the so-called ‘trade and sustainability chapters’ have found their way into the EU's FTAs as well as into its Generalised Scheme of Preferences (GSP) for developing countries. Since 2019, the EU also provides for the explicit inclusion of the Paris Agreement on Climate Change in its FTAs to mitigate global warming. In addition, the European Commission expects EU trade policy to facilitate trade in environmentally friendly goods and services and thereby to encourage respective investment  Average number of environmental norms covered in EU FTAs Data source: Morin et al. (2018) – TREND database; authors’ calculations. Am 24. November wurde auf dem Ökonomieblog der WU im Standard ein Artikel von meiner Kollegin Pia Heckl (WU) und mir - im Namen der VrauWL -veröffentlicht. Er hebt nicht nur hervor, wie groß die Gender-Gap in der Wirtschaftsforschung ist, sondern auch, welchen großen Einfluss es hätte, wenn Leitungsfunktionen von Wirtschaftsforschungsinstituten mit Ökonominnen besetzt würden. Es versteht sich von selbst, dass nur top qualifizierte Personen in Frage kommen (na no na ned!) - bei gleicher Qualifikation sollte unserer Ansicht nach jedoch die weibliche Kandidatin bevorzugt werden, um die gläserne Decke zu durchbrechen. Anlass für den Artikel war die Info von Christoph Badelt, dass er die Leitungsfunktion des WIFO (Österreichisches Wirtschaftsforschungsinstitut) nach Ablauf der aktuellen Amtsperiode mit September 2021 übergeben wird. Seit der Gründung im Jahr 1927 standen nur Männer an der Spitze des WIFO. Hier geht's zum Artikel. In der Zwischenzeit wurde Martin Kocher im Jänner 2021 kurzfristig als Arbeitsminister einberufen. Nun müssen gleich mehrere Leitungsfunktionen nachbesetzt werden: seine Funktion als Leiter des IHS (Institut für Höhere Studien), als Vorstand des Statistikrats und Präsident des Fiskalrats. 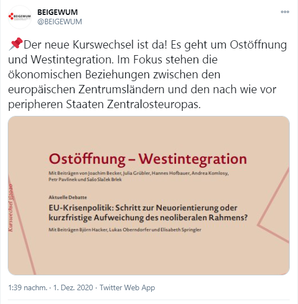 Am 1. Dezember 2020 wurde die "Kurswechsel"-Ausgabe des BEIGEWUM (Beirat für gesellschafts-, wirtschafts- und umweltpolitische Alternativen) zum Spezialthema "Ostöffnung - Westintegration" veröffentlicht. Dazu habe ich einen Artikel zu Österreichs wirtschaftlichen Beziehungen mit "Osteuropa" (insbesondere den Visegrád-Staaten) beigetragen und das Editorial zusammen mit Joachim Becker (WU) verfasst.  Am 30. November 2020 wurde das Buch China's Belt and Road Initiative, herausgegeben von Alfred Gerstl und Ute Wallenböck, über den Routledge Verlag veröffentlicht. Robert Stehrer und ich haben dazu ein Kapitel beigetragen. Book Description This edited volume presents a trans-disciplinary and multifaceted assessment of the strategic and economic impacts of China’s Belt and Road Initiative (BRI) on three regions, namely Central Asia, Southeast Asia, and Central Eastern Europe. The contributions to this book demonstrate the requirement of a more realistic view concerning the anticipated economic benefits of the New Silk Road. The contributors critique the strategic effects of China’s opaque long-term grand strategy on the regional and global political order. Specific countries that are covered are Finland, Hungary, Kazakhstan, Malaysia, Poland, and Thailand. Additionally, case studies from South Asia and Africa, notably India and Ethiopia, enable insightful comparisons. Encouraging readers to critically challenge mainstream interpretations of the aims and impacts of the BRI, this book should interest academics and students from various disciplines including Political Science, International Relations, Political Geography, Sociology, Economics, International Development, and Chinese Studies.
Zum Nachlesen:
 Am 1. Dezember 2020 haben mein wiiw Kollege Oliver Reiter und ich ein dreistündiges Webinar zum Thema Handelsbeschränkungen abgehalten.
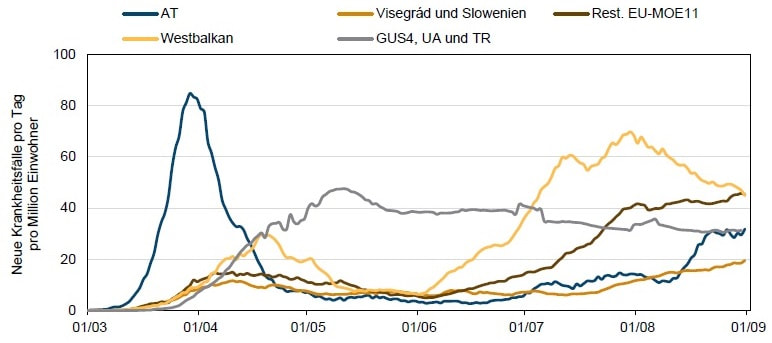
Es wurde im Rahmen des BMDW Außenwirtschaftscurriculums über die Verwaltungsakademie des Bundes (VAB) und in Kooperation mit dem FIW (Research Centre International Economics) angeboten, war aber für die breite Öffentlichkeit zugänglich. Die Internetverbindung hat zum Glück die drei Stunden hindurch gehalten. ;) Sowohl die Präsentationsfolien als auch die Aufzeichnung des Webinars stehen auf dem Blog des FIW zur Verfügung. Mitte März haben wir die Prognose für 23 Länder in Mittel-, Ost- und Südosteuropa präsentiert. Kurz darauf hatte sich das Virus nicht nur in Italien sondern Mitteleuropa ausgebreitet. Der Lockdown in Österreich stand bevor, osteuropäische Nachbarn reagierten bereits mit Grenzschließungen und anderen Maßnahmen, noch bevor merkliche COVID-Zahlen gemeldet wurden. Alle Prognosen waren kaum noch zu gebrauchen. Aufgrund der rasanten Entwicklungen entschied sich ein kleines Grüppchen des wiiw, einen Tracker einzurichten mit Fokus auf makroökonomische Entwicklungen. Hauptautor war mein Kollege Richard Grieveson. Ein regelmäßiger Beitrag von mir war, Zahlen zu Krankheits- und Todesfällen je nach Kontext in verschiedenen Grafiktypen nach Ländern und Gruppen sowie über die Zeit darzustellen. 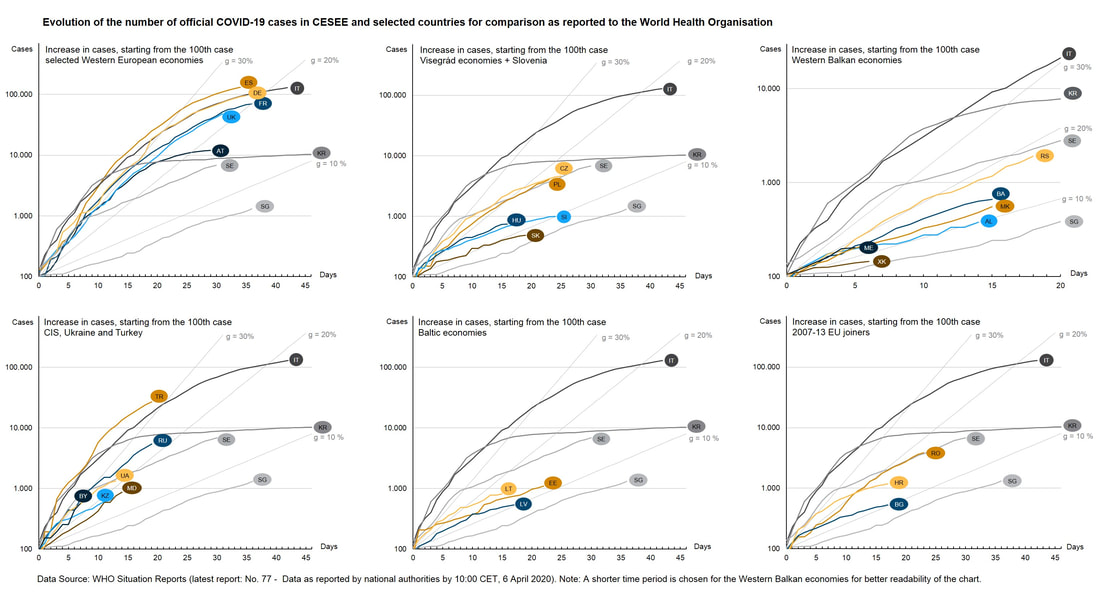
Am 10. September 2020 habe ich einen Bericht vorgestellt, der die Wirtschaftsbeziehungen Österreichs mit Ländern in Mittel-, Ost- und Südosteuropa (MOSOEL) durch die Coronavirus-Linse betrachtet. Von kurzfristigen Handelsbeschränkungen, dem Einbruch der Nachfrage nach Autos, ersten Erholungszeichen bei den Nächtigungszahlen ausländischer Touristen nach Partnerländern, der Entwicklung notleidender Kredite in Ländern, in welchen Österreichs Banken stark vertreten sind, oder die Bedeutung ausländischer Arbeitskräfte für die österreichische Wirtschaft, auch in sogenannten "systemrelevanten" Berufen. Der Bericht, die Präsentation zur Pressekonferenz, und die Daten dazu sind kostenlos abrufbar. Die Gesundheitskrise stellt die engen Wirtschaftsbeziehungen zwischen Österreich und Osteuropa vor die größte Zerreißprobe seit den 1990er-Jahren.
Durchwachsene BIP-Wachstumsprognosen für Österreich und die Länder in Mittel-, Ost- und Südosteuropa (MOSOEL), in % für das Jahr 2020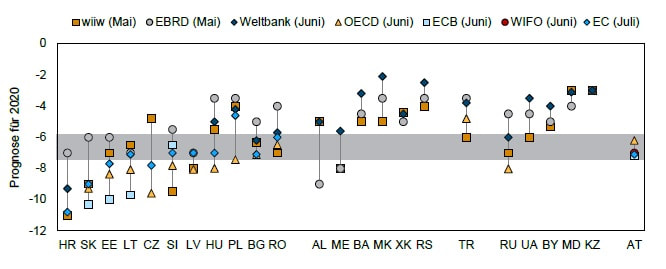 Quelle: EBRD, EC, ECB, Glocker/WIFO, Grieveson/wiiw, Weltbank, Darstellung des wiiw; Anmerkung: Länder sortiert nach der pessimistischsten Prognose pro Region. Die grau hinterlegte Fläche entspricht der Bandbreite der Wachstumsprognosen für Österreich. Die wichtigsten Studienergebnisse in Kürze:
The 1st of October constitutes the National Day of the People’s Republic of China. This year marked its 70th anniversary. Political topics were dominating public and private media responses in Europe, primarily related to:
The bubble size of the following charts is in relation to the world total (e.g. population) or the world average (e.g. CO2 emissions per capita). The bubbles are therefore comparable across China, the EU and the US, as well as in relation to the rest of the world over time, which is particularly interesting in light of the allegedly ongoing economic and military competition among the biggest economies in the world. A matter of size 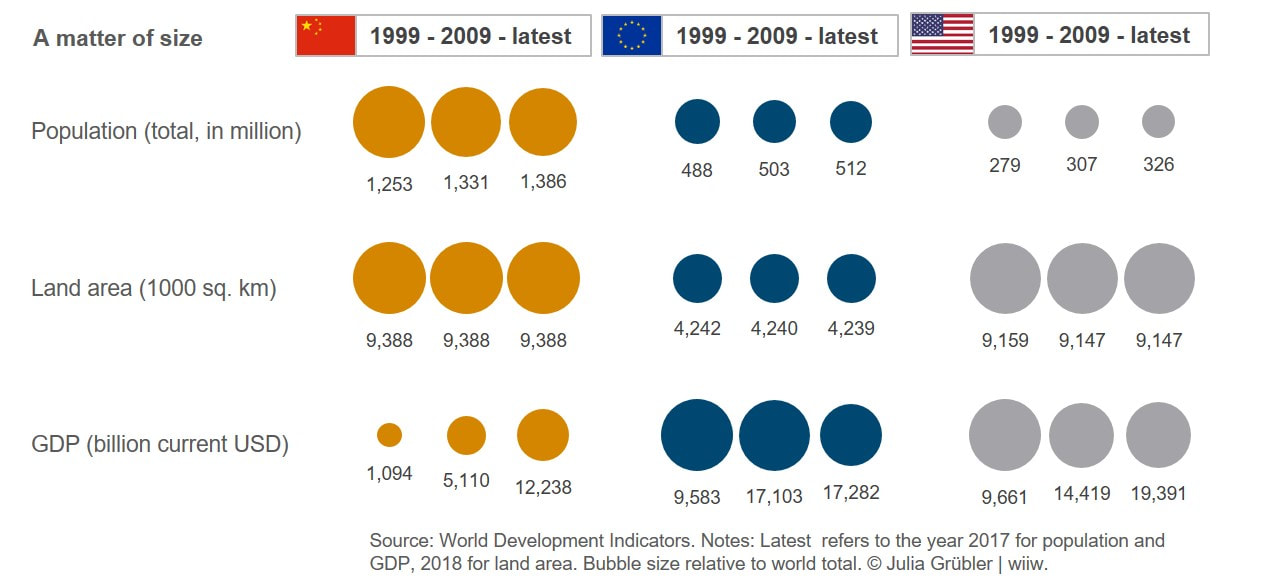 China is often referred to as the second largest economy in the world. Is it? In population size it is definitely leading the world ranking with more than one and approaching 1.5 billion citizens, followed by India and – with a big gap – by the US. China and the US are more similar in land area, globally ranked third and fourth, respectively (after Russia and Canada), being more than twice as big as the EU. The most frequently used indicator for economic size is the gross domestic product (GDP), showing the value of goods and services produced. It is worth taking a closer look at these bubbles: First, given that the European Union is one single market, the EU actually is the second largest economy in the world with respect to GDP. Second, the increase of the Chinese economy is stunning, yet, its size is still far off the US level, in particular when considering the four times bigger population size. Third, although the economic output of the EU and the US is growing, their bubbles (i.e. the shares in world GDP) are shrinking, with other developing countries and emerging markets growing faster. Size does not imply wealth 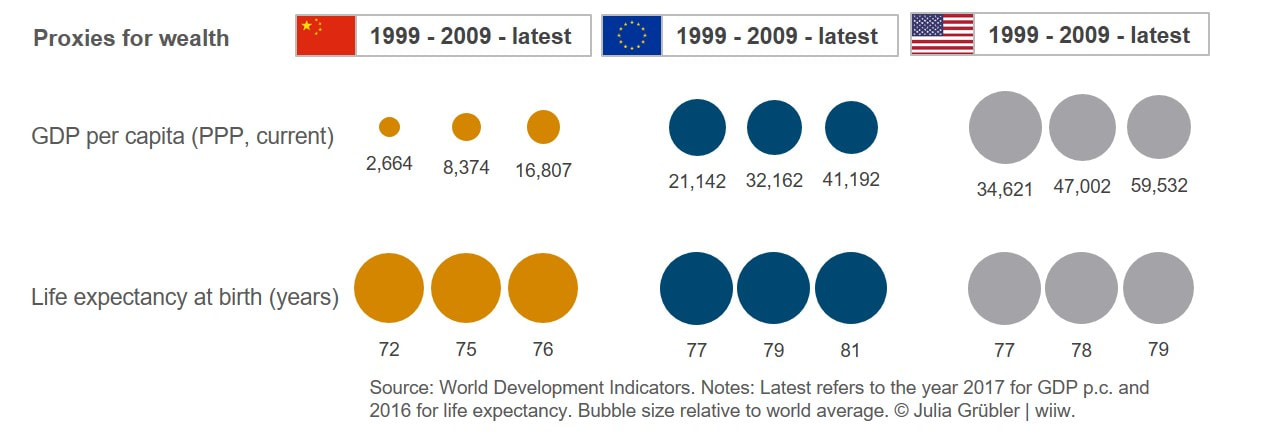 The race for the status of the world’s biggest economy (or biggest GDP) relatively frequently pops up in the media. More seldom, total economic output is set in relation to its population. GDP per capita corrected by different price levels and thus costs of living (termed “at purchasing power parities”, PPP) for China was not growing as fast as its total GDP. Considering this indicator, even today the US is three times as wealthy as China.
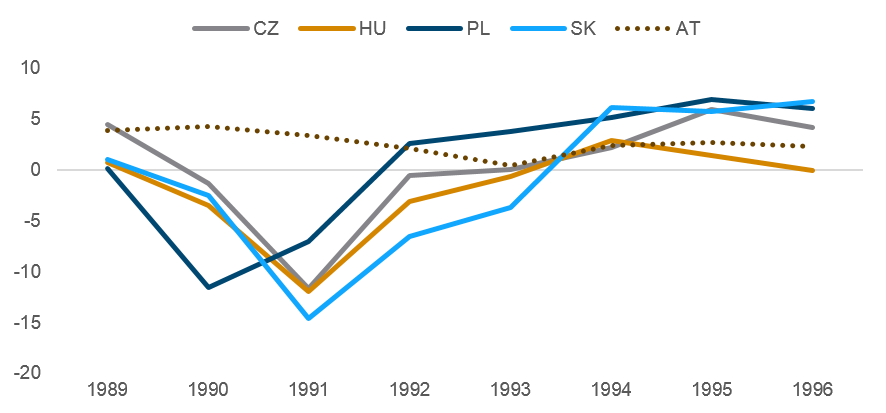
GDP and income are important indicators, but obviously not sufficient to judge how well-off countries’ citizens are. The educational system, the health care system and related out-of-pocket payments, retirement schemes, people’s rights and public infrastructure are just a few dimensions which would have to be considered. One non-monetary indicator for wellbeing is life expectancy at birth, which has been above the world average for all three economies. In 2016, worldwide life expectancy averaged 72 years. In the EU we can consider ourselves lucky to live on average 9 years longer; 7 years in the US and 4 years in China. Am 19. August vor 30 Jahren fand ein politisches Picknick an der Grenze zwischen Ungarn und Österreich statt, das meiner Meinung nach immer wieder in Erinnerung gerufen werden sollte. Anlässlich des Jubiläums habe ich einen kurzen Artikel geschrieben, der (in ähnlicher Form) als wiiw-News & Opinions erscheinen wird: Von der provisorischen zur tatsächlichen Ostöffnung Beim Paneuropäischen Picknick vor 30 Jahren sollten sich West- und Osteuropa symbolisch annähern. Dass die Ostöffnung unmittelbar bevorstand und wie holprig sie verlaufen würde, war damals noch nicht absehbar.
Ein Picknick als der Anfang vom Ende des Ostblocks Bereits im Mai vor dreißig Jahren wurde der Abbau des Grenzzauns zwischen Österreich und Ungarn, mit der (offiziellen) Begründung, Instandhaltungskosten der Grenzsicherungsanlagen zu reduzieren, begonnen. Die Entwicklung wurde jedoch geschickt für politische Inszenierungen genutzt: Am 27. Juni 1989 wurde von den Außenministern Ungarns (Gyula Horn) und Österreichs (Alois Mock) besonders medienwirksam ein Stück Grenzzaun des Eisernen Vorhangs zwischen der burgenländischen Gemeinde Klingenbach und dem ungarischen Sopron (Ödenburg) durchtrennt. Weniger als zwei Monate später und kaum 10 Kilometer entfernt wurde am 19. August 1989 das Paneuropäische Picknick von der Paneuropa-Union und dem Ungarischen Demokratischen Forum organisiert. Hierbei sollte – behördlich genehmigt – die Grenze provisorisch für drei Stunden geöffnet werden. Dabei nutzten hunderte Bürger der Deutschen Demokratischen Republik (DDR) die Möglichkeit zur Flucht. Glücklicherweise kam es zu keinem gewaltsamen Einschreiten der Grenzbeamten. Trotz verstärkter Grenzkontrollen glückten fortan täglich über hundert Fluchtversuche von Ungarn nach Österreich bis am 11. September desselben Jahres die Grenzen für DDR-Bürger gänzlich geöffnet wurden.[1] Auch wenn man über die historische Bedeutung der Ereignisse vom 19. August diskutieren kann, einig ist man sich doch, dass sie die Entwicklungen in Richtung Fall der Berliner Mauer im November 1989, Wiedervereinigung Deutschlands im Oktober 1990 und Auflösung des Rats für gegenseitige Wirtschaftshilfe und des Warschauer Pakts im Sommer 1991 beschleunigten. Aller Anfang ist schwer – aber dieser war kaum tragbar Der Osten war nun offen. Aber die Euphorie der Ostöffnung war nicht von unmittelbaren Wohlstandszuwächsen begleitet. Die Transformation von Plan- zu Marktwirtschaften (mit der auch der unmittelbare Wandel von Auto- zu Demokratie erwartet wurde) löste wahrlich einen für die Volkswirtschaften und ihre Bevölkerung schmerzhaften Schock aus. Die in vielen Ländern rasant vollzogene – und unter dem Namen „Schocktherapie“ bekannte – massenhafte Privatisierung von Staatsbetrieben, Deregulierung und Handelsliberalisierung nach dem Washington Consensus gelang nirgendwo gänzlich ohne bittere nicht intendierte Nebeneffekte wie z.B. Anfälligkeit für Insiderdeals und Korruption, Preisverfall der zu privatisierenden Staatsbetriebe, Zusammenbruch der Industrieproduktion durch Konkurrenz aus dem Westen und Konsumrückgänge durch steigende Arbeitslosigkeit und Stadt-Land-Ungleichheiten. Zu den frühen Kritikern der angebotsseitig orientierten Schocktherapie gehörte der frühere Direktor des wiiw (1991-1996) – Kazimierz Łaski – der entgegen der weitverbreiteten Meinung einen Rückgang der Produktion und eine anhaltende Rezession in den Transformationsländern für die 1990er-Jahre prognostizierte.[2]
Die politischen Weichen werden gerade wieder gestellt Die positive Wirtschaftsentwicklung darf aber nicht als Selbstverständlichkeit für die Zukunft angesehen werden. Mit der Ostöffnung und Transformation wurde die Umstellung auf das international dominierende System des liberalen Kapitalismus und Demokratie assoziiert. Es wurde allerdings relativ bald klar, dass diese sich nicht gegenseitig bedingen. Wirtschaftlich haben sich „Varieties of Capitalism“ etabliert, während in manchen Ländern Nationalismus[4] durch die Wirtschaftskrise seit 2007/08 und in noch stärkerem Ausmaß von der „Migrationskrise“ im Jahr 2015 beflügelt wurde. Dies gilt auch für Österreich und die Visegrád-Staaten, wie man am Beispiel der Errichtung neuer Zäune an den Grenzen zu Kroatien und Serbien 2015 oder den Rückzug aus dem UN-Migrationspakt Ende 2018 sieht. Nationalistische Entwicklungen – mit zunehmenden Auseinandersetzungen mit der Europäischen Kommission – werden für die politische und auch wirtschaftliche Konvergenz oder Divergenz in Europa noch eine bedeutende Rolle spielen – für West- und Osteuropa, sowohl innerhalb der Pforten der EU, aber besonders an den teilweise von neuen Zäunen markierten östlichen und südlichen Außengrenzen. [1] Eine detaillierte Beschreibung von der Idee bis zur Verwirklichung des Paneuropäischen Picknicks von Laszlo Nagy: http://www.chronik-der-mauer.de/material/178896/laszlo-nagy-das-paneuropaeische-picknick-und-die-grenzoeffnung-am-11-september-1989?n
[2] Siehe dazu zB: Laski K. (1997), „Lessons to be drawn from main mistakes in the transition strategy”. In: Zecchini S. (eds) Lessons from the Economic Transition. Springer, Dordrecht. [3] Siehe dazu zB: wiiw Monthly Report No. 1/2016 - Special Issue: “Reality Check – wiiw Economists Reflect on 25 Years of Transition” https://wiiw.ac.at/p-3766.html und Kornai J (1994), „Transformational Recession: The Main Causes”, Journal of Comparative Economics, Vol. 19, No. 1, pp. 39-63. [4] Siehe z.B. “wiiw Reality Check: Remembering transition” von Gabor Hunya. Anlässlich des ersten Jahrestages der Unterzeichnung des EU-Japan Wirtschaftspartnerschaftsabkommens habe ich einen wiiw-News-Artikel auf Englisch verfasst: July 2019 marks the first anniversary of the EU-Japan trade agreement. Initial effects are already observable. However, its full implementation still lies 20 years ahead of us.
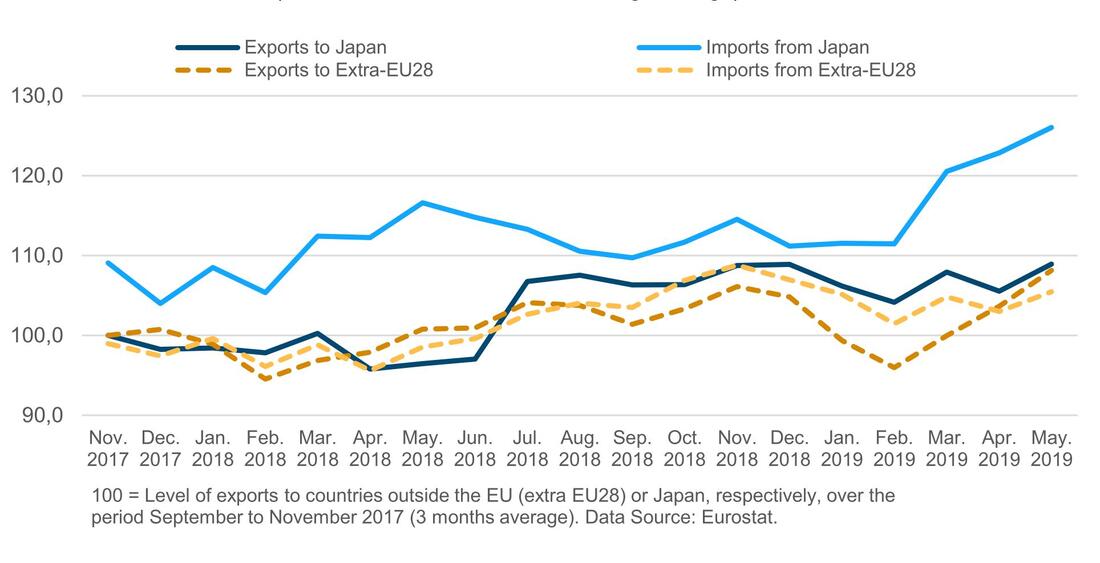 Graph: Goods trade of the EU28 (Index on the three months moving average) Graph: Goods trade of the EU28 (Index on the three months moving average) The Economic Partnership Agreement (EPA) between the EU and Japan was signed one year ago – on 17 July 2018 at the EU-Japan summit in Tokyo. It entered into force on 1 February 2019, surprisingly quickly for an agreement of this type. It is considered the most ambitious EU trade agreement with any Asian economy. EU exports to Japan picked up already last year, while imports have soared during the first months of 2019, suggesting that the EPA may have already had an impact. The increase in trade flows with Japan indeed appears more pronounced compared to trade with other economies outside of the EU28, particularly on the import side (see chart below). Reducing tariffs and non-tariff barriers over two decades Many products entered the Japanese and EU markets duty-free already prior to the establishment of the EPA. 36% of all agricultural products and 55% of industrial products faced no duty when exported to Japan from another WTO member, such as the EU. Likewise, a zero-tariff applied to 32% of agricultural and 26% of industrial goods exported to the EU from other WTO members, such as Japan. Shares of duty-free imports were even higher. Since the agreement came into force, 90% of the EU’s exports to Japan are no longer subject to duties. Although tariffs between the EU and Japan are already at a comparatively low level, the schedule for further tariff reductions to cover 99% of EU tariff lines and 97% of Japanese tariff lines is quite comprehensive (Annex 2-A on tariff elimination and reduction is a document of 236 pages; the agreement itself counts 562 pages). Table: Tariff profiles of Japan and the EU prior to the EPA Shares of tariff lines and shares of imports for different tariff rates 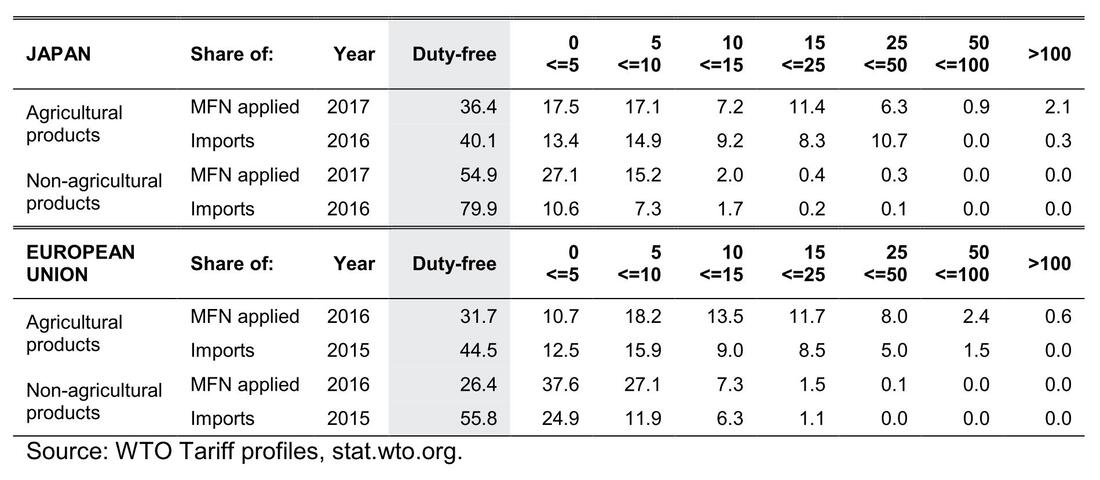 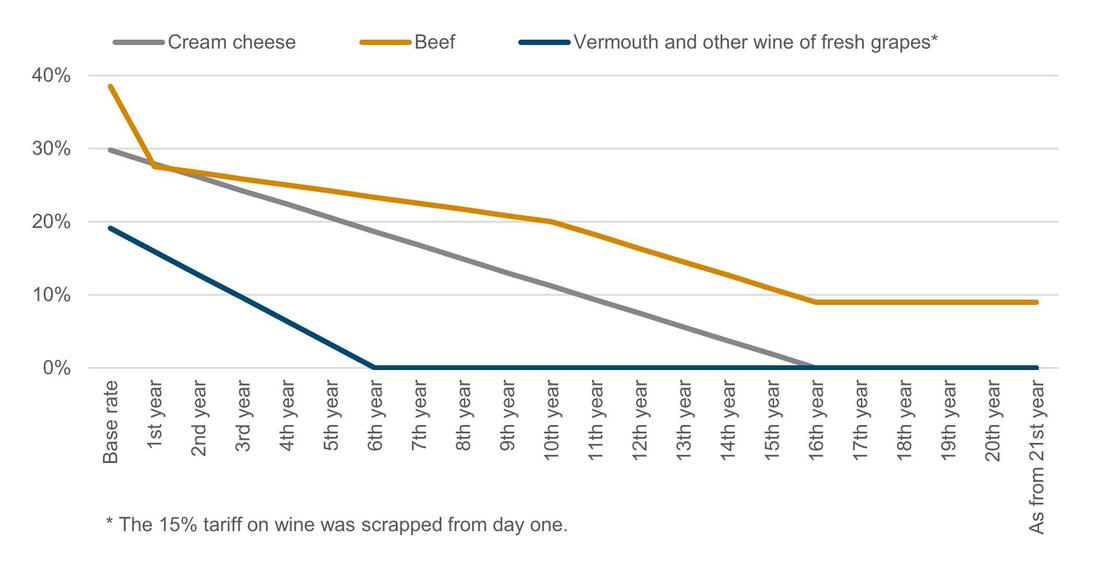 Graph: Examples of ‘easy’ tariff schedules Graph: Examples of ‘easy’ tariff schedules The tariff reductions are likely to have a significant impact on the EU’s agricultural sector. The Commission mentions products for which it assumes the biggest gains for Europe. In the agricultural and food sectors a boost in exports of pork, beef, wine, cheese and processed products such as pasta, chocolate, candies or tomato sauce are expected. However, the speed at which tariffs and non-tariff barriers are reduced by both parties varies by product. Schedules are outlined for a period of 20 years after the agreement’s entry into force. Although many trade liberalisation steps are taken during the first years of its application, the full potential of the EPA will only materialise after two decades. Furthermore, tariff cuts are more complex than is often assumed. For example, glucose and glucose syrup containing added sugar are targeted with a tariff of 85.7% or 60.90 yen/kg (whichever is greater). For this product a tariff rate quota was agreed upon (TRQ-13 scheme), increasing the aggregate quota quantity which can enter the Japanese market without duty from 1,780 metric tonnes in the first year to 5,340 metric tonnes for the 12th year and thereafter. Imports exceeding the quota are subject to customs duties unaffected by the EPA. In general, stepwise reductions, mixed tariffs and safeguard clauses arise in more sensitive sectors, e.g. agriculture, which are given more time to adapt to trade liberalisation. 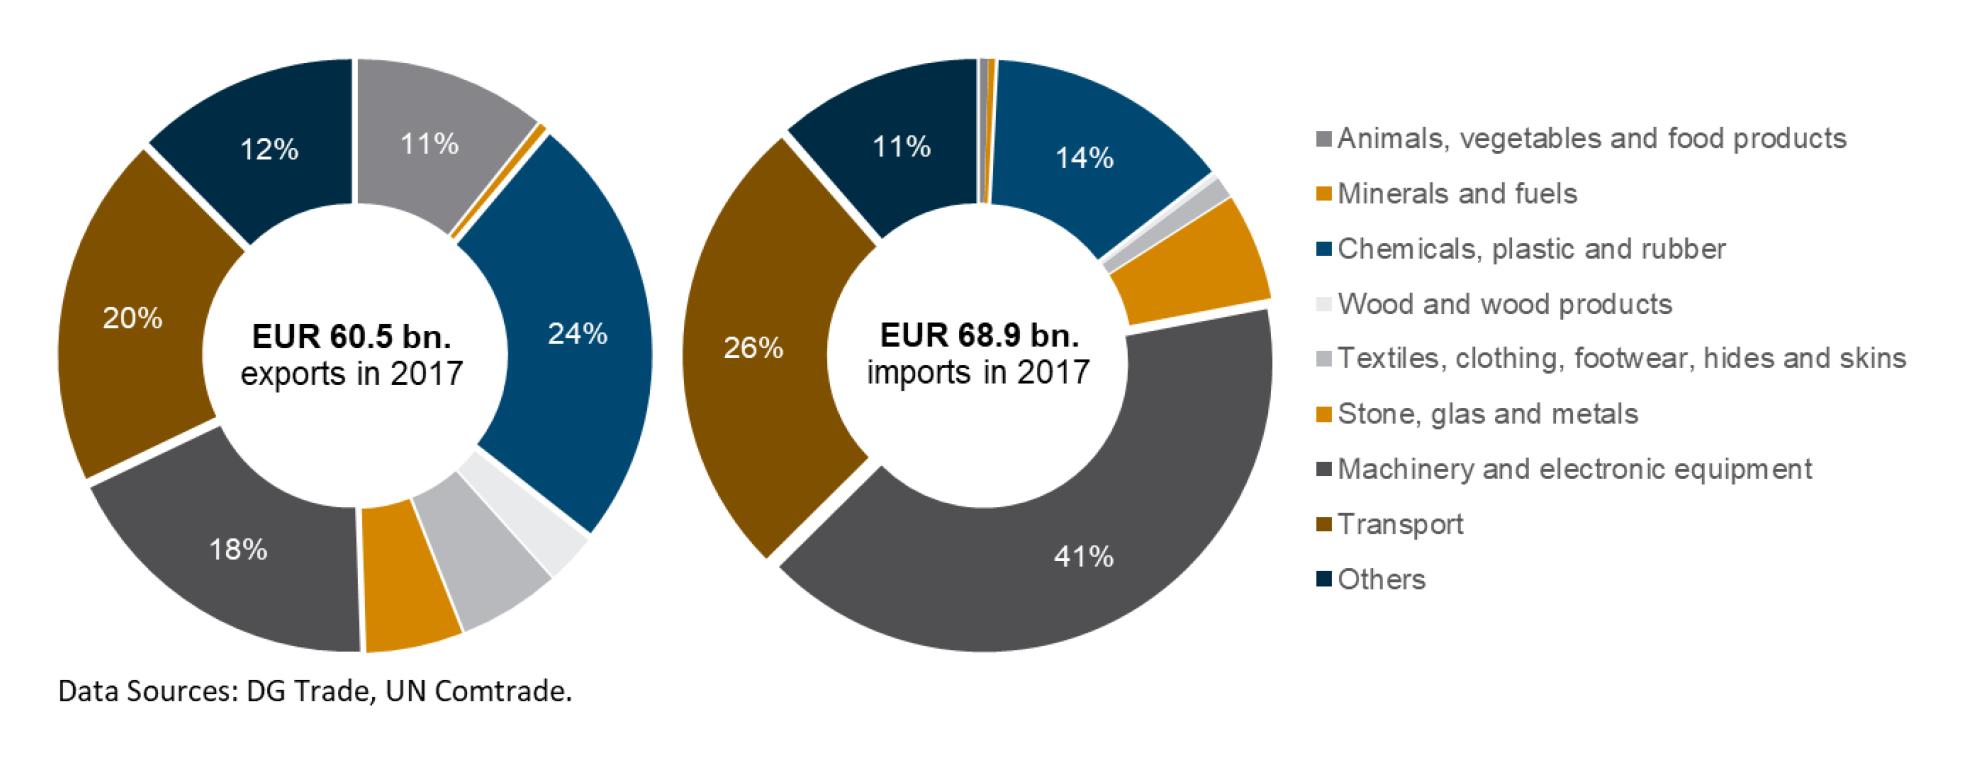 Graph: EU exports and imports to and from Japan in 2017 Graph: EU exports and imports to and from Japan in 2017 Setting a “global gold-standard” Roughly 40% of EU exports and more than 60% of EU imports are machinery, electronic equipment and goods related to the transport sector. For these, an agreement on applying the same international standards – regarding product safety, environmental protection and quality management systems – play a more crucial role than tariff cuts. This is because they make double testing and certification unnecessary, thereby reducing non-tariff barriers to bilateral trade. For example, Japan is aligning its standards for cars and car parts to vehicle regulations laid out by the United Nations Economic Commission for Europe (UNECE), which also form the basis for EU standards. The EPA with Japan also covers sensitive topics so far underrepresented in trade agreements. Out of 296 agreements covered by the Trade Agreement Heterogeneity Database (TAHD), only 86 include trade in services, 85 cover investments, 66 address environmental topics and 43 agreements tackle labour issues.
The world trading system based on rules laid out by the World Trade Organisation (WTO) is under acute threat by the United States blocking the reappointment of appeals judges and the standstill in the Doha Round negotiations. Reasons include the increasing number, heterogeneity and economic power of developing countries engaging in international trade and in multilateral trade negotiations. This article reviews the EU’s trade relations with developing countries from the early steps until today. wiiw Monthly Report available for download. 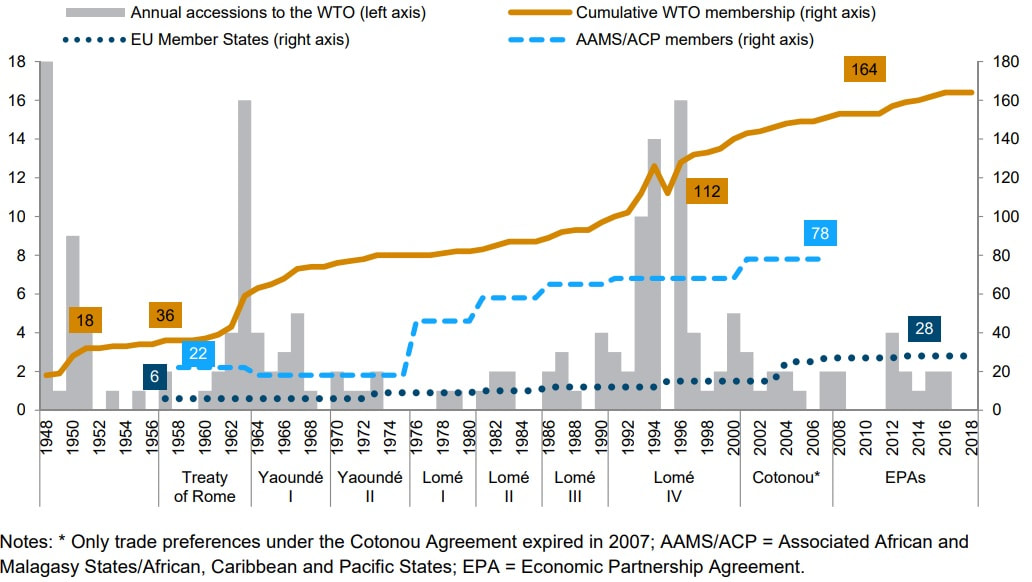 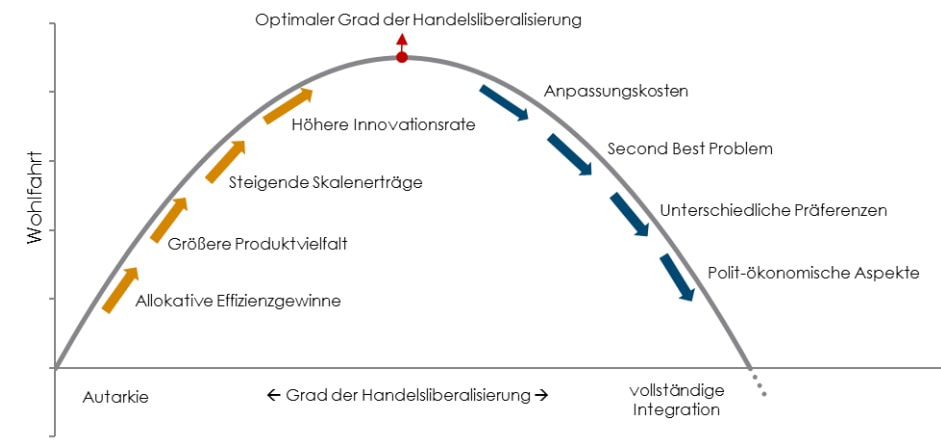 Die Verabschiedung des Allgemeinen Zoll- und Handelsabkommens (GATT), die Gründungsschritte in Richtung Europäische Union und der Beginn der Entkolonialisierung Afrikas liegen zeitlich sehr eng beieinander. So prägten die EU und ihre sukzessiven Erweiterungen von Anbeginn das Präferenzsystem der Welthandelsorganisation für Entwicklungsländer als auch die globale Verbreitung von Freihandelsabkommen. Letztere wird beschleunigt durch den Stillstand in den multilateralen Verhandlungen der „Doha-Entwicklungsrunde“ der Welthandelsorganisation (WTO) und in jüngster Vergangenheit durch den Rückzug der USA aus mega-regionalen Verhandlungen, aufflammende Handelskriege und gegen das Welthandelssystem gerichtete Drohungen. Bereits heute findet 40% des Handels der EU und 45% des österreichischen Handels mit Drittstaaten mit Partnerländern innerhalb des Rahmens eines Freihandelsabkommens statt. Sollten alle aktuellen Verhandlungen tatsächlich zu einem Abschluss kommen, würden 80% der Extra-EU-Handelsflüsse der EU und Österreichs über bi- oder plurilaterale FHA geregelt. Der Umfang der Abkommen variiert erheblich und zielt insbesondere bei der jüngeren Generation der EU-Abkommen nicht nur auf Reduktionen von Zöllen und Handelshemmnissen, sondern verstärkt auf die Harmonisierung von Standards ab. Da unterschiedliche Regulierungen (z.B. im Gesundheits- oder Umweltbereich) teilweise auf unterschiedliche Präferenzen der Bürger und Bürgerinnen zurückzuführen sind, ist davon auszugehen, dass der optimale Grad an Handelsliberalisierung und wirtschaftlicher Integration nach Partnerländern variiert.
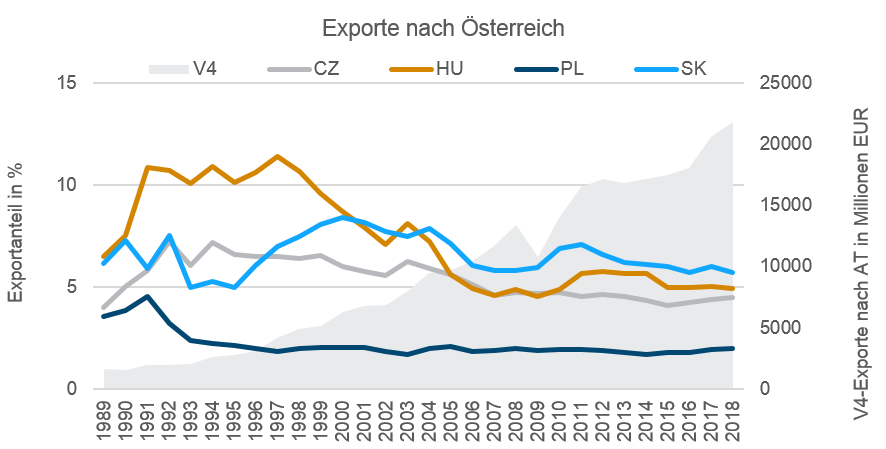
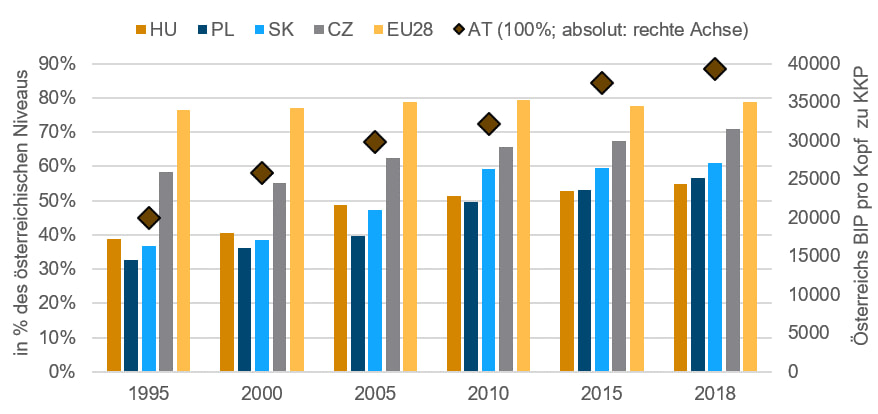
FIW Policy Brief (in German | auf Deutsch) zusammen mit Roman Stöllinger: Download. Folien zur AW Vorlesung (in German | auf Deutsch): Download. 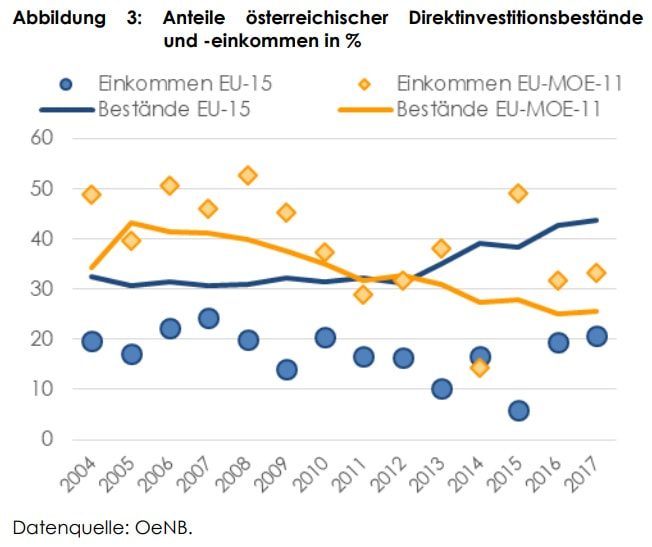 Die österreichische EU-Ratspräsidentschaft, die mit 1. Juli 2018 begann, steht unter dem Stern der Wiederbelebung seiner Brückenfunktion zwischen Ost und West; denn während sich die Länder in Mittel-, Ost- und Südosteuropa (MOSOEL) wirtschaftlich Westeuropa annähern, scheinen sich politische Bruchlinien zu verhärten. Diese Entwicklung betrifft insbesondere die Visegrád-Staaten (Polen, Slowakei, Tschechien, Ungarn), welche für Österreichs Wirtschaft in den letzten Jahren zunehmend als Handelspartner und Destination für Investitionen an Bedeutung gewonnen haben. Ein besonders ambivalentes wirtschaftliches und politisches Verhältnis mit Osteuropa ergibt sich im Bereich Migration – aus Süd- und Osteuropa nach Österreich bzw. von Personen aus Drittstaaten durch diese Region nach Österreich. Der Boykott der Umverteilung von Geflüchteten zog bereits Vertragsverletzungsverfahren für Länder in der österreichischen Nachbarregion nach sich. Zusammen mit den heuer eingeleiteten Disziplinarmaßnahmen aufgrund von Verstößen gegen die Rechtsstaatlichkeit könnten sie im neuen EU-Budget zu wesentlichen Kürzungen von Zuteilungen für Osteuropa und durch die intensiven wirtschaftlichen Verflechtungen auch für Österreich zu negativen wirtschaftlichen Konsequenzen führen. Diese Situation verschärft sich durch die erwartete Lücke im EU-Budget durch den Austritt Großbritanniens aus der EU und turbulente Zeiten für das internationale Handelssystem durch gegensätzliche Politiken der USA und Chinas.
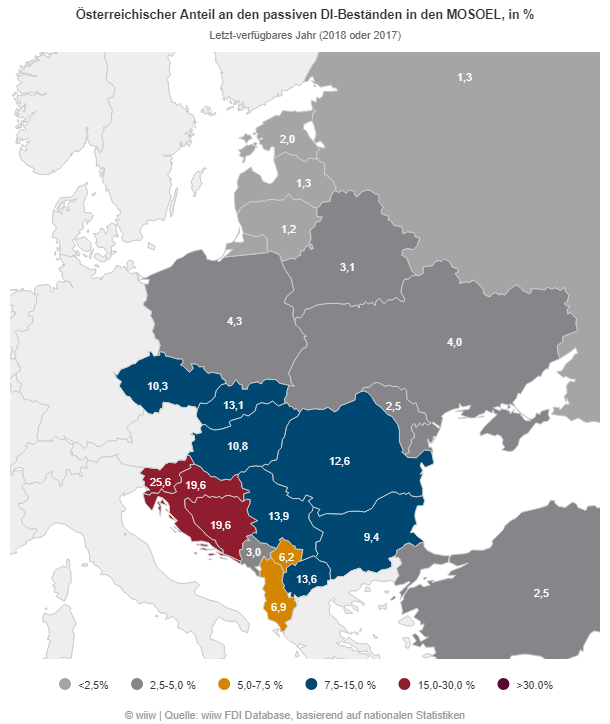
FIW Policy Brief (in German | auf Deutsch): Download. Folien zur AW Vorlesung (in German | auf Deutsch): Download. Being a small economy in the heart of Europe, Austria’s significance as a foreign investor in Central, East and Southeast Europe (CESEE) is often overlooked. For all fifteen countries under consideration, Austria ranks among the top 10 investors, dwarfing global players such as the United States or China. Likewise, investments in immediate neighbouring countries feature prominently in Austria’s outward FDI stocks and appear overproportionately profitable. wiiw Monthly Report available for download. 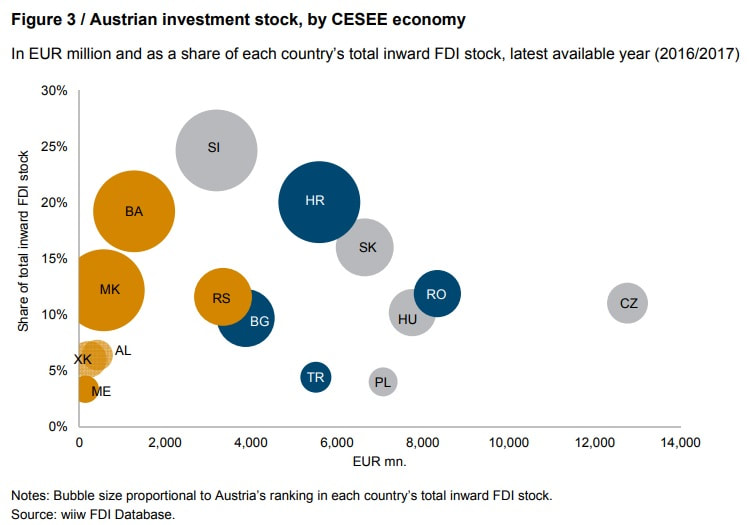
Einige wichtige Eckpunkte zur 'Nichtsoneuen Nichtmehrseiden-Nichtnurstraße' hab' ich - bzw. haben Economezer Scrooge und die Geister der Seidenstraße - beim Science Slam in völliger Dunkelheit am 30.01.2018 im Dialog im Dunkeln in Wien zusammengefasst. Wer mehr wissen will, kann unsere Ergebnisse in voller Länge in unserer Studie oder kurz und knapp in unserem Policy Brief nachlesen oder einen Teil davon im YouTube-Video zum wiiw Spring Seminar nachhören. *** During the last two years I've worked more on China, in particular due to its "Belt and Road" initiative, better known in Austria as the "New Silk Road". Geographically it covers all of Eurasia and Africa with a focus on infrastructure investments in the fields of transport, energy, as well as information and communication technology. Recently, Austria has shown its interest in the initiative during the biggest official visit in the history of Austria - to Beijing in April this year! I have summarised some of the most important points on the 'Not-so-New No-more-Silk Not-only-Road' in the form of Economezer Scrooge and the ghosts of the Silk Road during my Science Slam in the Dark on 30 January 2018 at Dialog im Dunkeln in Vienna. Whoever likes to know more is more than welcome to consult the results of our research in our report or, in brief, in our policy note or to watch the YouTube video of our wiiw spring seminar covering parts of it.
The tourism sector constitutes a core industry of the Austrian economy. Austria’s trade surplus for tourism services climbed to a high of EUR 8.8 billion in 2016. Germans continue to be the most important group of foreign tourists; yet, their importance is decreasing while positive trends are observable for tourists from countries in Central, East and Southeast Europe (CESEE), in particular from Austria’s immediate neighbours. wiiw Monthly Report available for download.  |

 RSS-Feed
